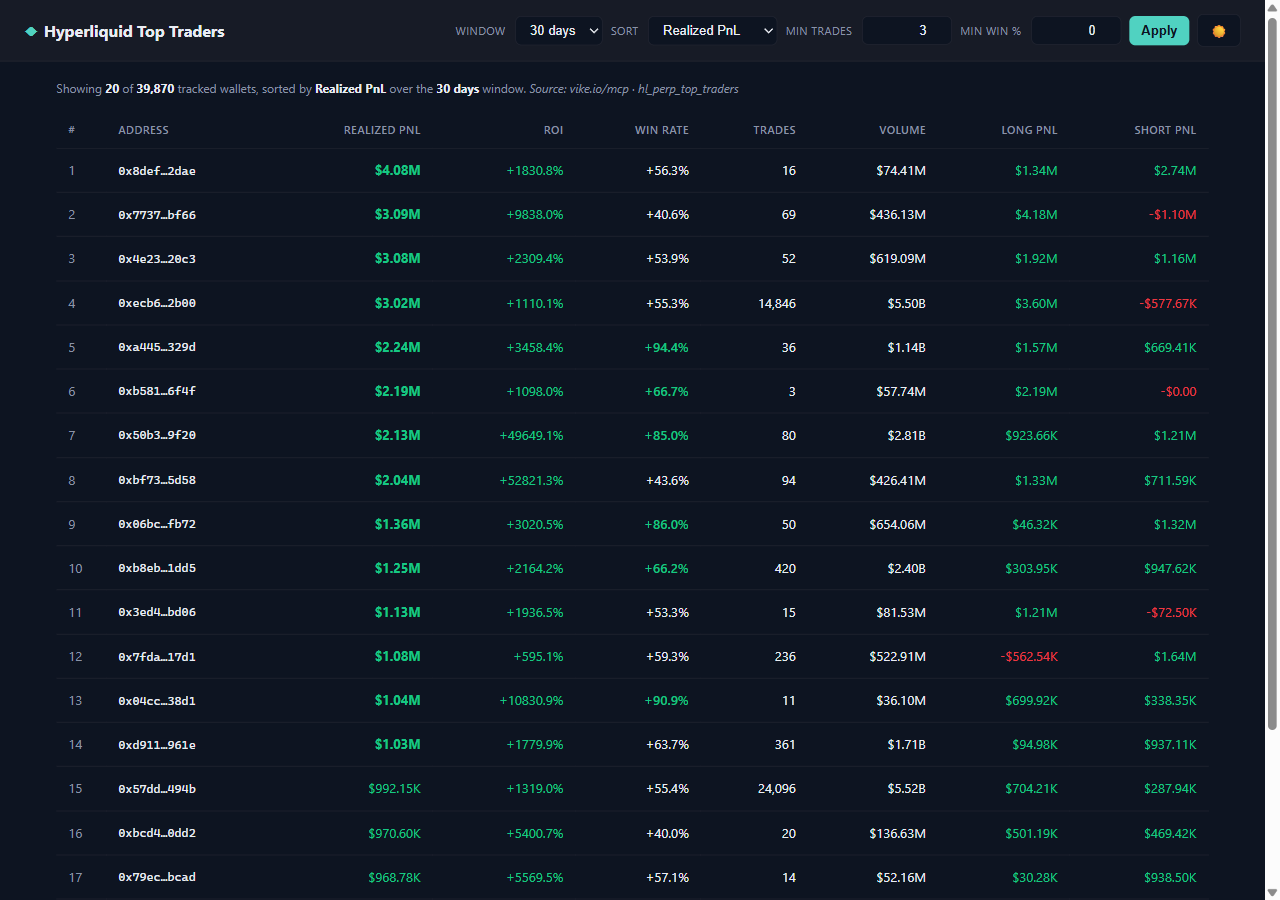
There are ~40,000 Hyperliquid perpetuals wallets the Vike API is currently tracking. "Show me the top 20 by realized PnL over the last 30 days, but only wallets with ≥ 3 trades and a win rate ≥ 60 %" is the kind of query you'd normally need a small ETL pipeline for — pull every wallet's trade history, aggregate per wallet, rank, filter. This demo answers it with a single JSON-RPC call to one MCP tool, and the entire front end is one HTML file.
Live demo: demo.vike.io/hl-top-traders/. Source: vike-io/demo-trading-apps/hl-top-traders.
How it works
The page is a thin shell around the hl_perp_top_traders tool on vike.io/mcp. The Cloudflare Worker in this case forwards POSTs from /api/hl-top-traders/vike/mcp upstream to https://vike.io/mcp, attaching the X-API-KEY header from the VIKE_API_KEY env var. The browser builds a JSON-RPC envelope, fires it off, parses the result, and renders.
Six filter knobs sit in the header — window, sort, min_trades, min_win_rate, plus the size (hard-coded to 20 in this UI). Click Apply and every knob is bundled into the arguments of the tool call. The server does the ranking; the browser does the rendering.
The one call that powers the page
This is the entire data layer. Everything else is rendering:
const VIKE_MCP = "/api/hl-top-traders/vike/mcp";

async function loadTraders() {
  const args = {
    window: $("#window").value,           // "1d" | "7d" | "30d" | "all"
    sort: $("#sort").value,               // "pnl" | "roi" | "win_rate" | "volume" | "trade_count" | "drawdown"
    size: 20,
    min_trades: Number($("#min-trades").value || 0),
    min_win_rate: Number($("#min-win").value || 0)
  };

  const res = await fetch(VIKE_MCP, {
    method: "POST",
    headers: { "Content-Type": "application/json" },
    body: JSON.stringify({
      jsonrpc: "2.0",
      id: 1,
      method: "tools/call",
      params: { name: "hl_perp_top_traders", arguments: args }
    })
  });

  if (!res.ok) throw new Error(`Vike proxy ${res.status}`);
  const env = await res.json();
  if (env.error) throw new Error(`Vike: ${env.error.message || env.error.code}`);

  const text = env.result?.content?.[0]?.text;
  if (!text) throw new Error("Vike returned no content");
  const data = JSON.parse(text);

  state.rows = data.traders || [];
  state.total = data.total || 0;
  renderRows();
}
A few things worth pointing out:
- JSON-RPC 2.0 envelope.
jsonrpc/id/method/params— standard MCP shape. The same envelope works forperp_funding(see the perp-funding-spread case) and every other Vike MCP tool, only theparams.name+argumentschange. - The MCP "content envelope". The actual payload arrives as
env.result.content[0].text— a stringified JSON blob inside the MCPcontentarray. You have toJSON.parse(text)it. That's an MCP protocol convention, not a Vike quirk; every MCP tool that returns data hands it back as a text content item. - Two-level error checking.
res.okfor the HTTP layer (Worker reachable, upstream replied) andenv.errorfor the JSON-RPC layer (tool exists, arguments validated). Both can fail independently.
What the server returns per trader
Each row in data.traders is:
{
  "address": "0x8def...2dae",
  "total_realized_pnl": 4080000,
  "roi_pct": 1830.8,
  "win_rate_pct": 56.3,
  "trade_count": 16,
  "total_volume": 74410000,
  "long_pnl": 1340000,
  "short_pnl": 2740000
}
Already in USD, already as percentages, already aggregated for the chosen window. The render step is mechanical — a couple of formatters (fmtUsd, fmtPct, fmtInt, shortAddr) and one template literal per row:
tbody.innerHTML = state.rows.map((r, i) => {
  const pnlCls = r.total_realized_pnl >= 0 ? "up" : "down";
  const big = Math.abs(r.total_realized_pnl) >= 1e6 ? " big" : "";
  const winCls = r.win_rate_pct >= 65 ? " high" : "";
  const link = `https://app.hyperliquid.xyz/explorer/address/${r.address}`;
  return `<tr>
    <td class="rank">${i + 1}</td>
    <td class="addr"><a href="${link}" target="_blank" rel="noopener noreferrer">${shortAddr(r.address)}</a></td>
    <td class="num pnl ${pnlCls}${big}">${fmtUsd(r.total_realized_pnl)}</td>
    <td class="num">${fmtPct(r.roi_pct, 1)}</td>
    <td class="num winrate${winCls}">${fmtPct(r.win_rate_pct, 1)}</td>
    <td class="num">${fmtInt(r.trade_count)}</td>
    <td class="num">${fmtUsd(r.total_volume)}</td>
    <td class="num">${fmtUsd(r.long_pnl)}</td>
    <td class="num">${fmtUsd(r.short_pnl)}</td>
  </tr>`;
}).join("");
Each address links straight to the Hyperliquid explorer — click any row, you're on app.hyperliquid.xyz/explorer/address/<addr> looking at that wallet's full history.
What the server is doing for you
The status line — Showing 20 of 39,870 tracked wallets, sorted by Realized PnL over the 30 days window — is the part that's load-bearing. To produce those 20 rows the server has to:
- Maintain a continuously updated index of every wallet active on Hyperliquid perps (~40k as of the screenshot).
- Recompute per-wallet aggregates for every active window (1d, 7d, 30d, all-time) as trades come in.
- Apply the
min_tradesandmin_win_ratefilters. - Sort by the chosen field (six choices).
- Slice to
size.
If you wrote that yourself, step 1 alone would be a multi-day project. The endpoint is the whole point — the dashboard is just proof that consuming it is trivial.
What the dashboard looks like in code
| Component | Lines | What it does |
|---|---|---|
Inline CSS in <style> |
~85 | Dark/light theme, table styling, sticky header, color classes for .up / .down / .high |
<header> + filter controls |
~30 | Window + sort selects, two number inputs, Apply button, theme toggle |
loadTraders() |
~25 | Build args, POST envelope, parse result, set state, render |
Formatters (fmtUsd, fmtPct, fmtInt, shortAddr) |
~25 | Display helpers |
renderRows() |
~25 | Template literal per row, link to HL explorer |
| Error banner + retry | ~15 | Show / hide error UI |
| Theme + event wiring | ~20 | localStorage theme, button handlers |
The whole template is 284 lines including HTML, CSS, and JS. No build step, no dependencies, no charting library. The MCP tool does the work.
Comparison: this vs writing it yourself
| Step | DIY | This demo |
|---|---|---|
| Discover active wallets | Crawl Hyperliquid's WS feed, dedupe addresses over time | — |
| Pull each wallet's trade history | Per-address HTTP fan-out, paginate, rate-limit | — |
| Aggregate PnL / ROI / win rate per window | Per-trade rolling sums, careful timezone handling | — |
| Sort + filter | Sort whatever you can fit in memory | sort: "win_rate", min_trades: 50 |
| Re-rank on filter change | Recompute everything or cache aggressively | Re-fire the MCP call |
| Lines of code | Many thousand | ~25 for the fetch, ~30 for the render |
You'd write the DIY version once for fun and then never touch it again — it'd be too much surface to maintain as the venue evolves. The MCP version is one HTTP call; if Hyperliquid adds a new market tomorrow, the server picks it up and your dashboard sees it without a code change.
Gotchas
total_volumeis notional, not capital deployed. A wallet that round-trips $1B over a week with 10× leverage showstotal_volume = 1e9. The "trade size" filter (min_trades) is a count, not a notional threshold, so a 14,846-trade wallet in the screenshot has been very active — but you'd want to look at its ROI and per-trade size, not just its rank.- ROI % can be dominated by tiny denominators. A wallet that deposited $100, made $9,838, and stopped trading shows up at +9838 % ROI. The
min_tradesfilter is your friend here; bump it to ≥ 20 to drop the lucky tails. - Win rate ≠ profitability. A 95 % win rate with one massive loss is a Martingale signature. Cross-check against
long_pnlandshort_pnl— a wallet that's deeply negative on one side and positive on the other is doing something specific (delta-neutral, basis trades, etc). - The
sizecap. The dashboard hard-codessize: 20for layout reasons. The tool itself supports larger pages; if you reuse the snippet, raise it. - MCP envelope shape.
env.result.content[0].textis a JSON string inside the MCP content array — don't forget theJSON.parse. Same shape as every other Vike MCP tool, so the pattern transfers directly toperp_funding,wallet_summary,token_screener, etc. - Anonymity. These are public on-chain addresses. The wallets in the leaderboard are not necessarily one human each — exchanges, MMs, and bots show up at the top, and the same operator can sit behind many addresses.
The whole case is one HTML file and one Worker route. The interesting work happens on the server; the page is a renderer for a single MCP call.