"Smart money" on Polymarket is a cohort definition: wallets with $1k+ realized PnL across 5+ resolved markets. That filter alone strips out the speculation and leaves the actors who've been right enough times for size to call them "smart" — about 1–2 % of the population. Once you have the cohort, two questions are interesting:
- Flows — which active markets is this cohort piling into right now?
- Mispricings — which markets has the cohort accumulated below the current mid (i.e., they bought cheap, the market re-rated, and they're sitting on paper edge)?
This case is a single page that flips between those two views with one tab click. Both are powered by the same MCP tool (polymarket_smart_money on vike.io/mcp), with the mode argument flipping the output shape. A second tool (polymarket_market_detail) hangs off each row for the drill-in.
Live demo: demo.vike.io/polymarket-smart-money/. Source: vike-io/demo-trading-apps/polymarket-smart-money.
Mode 1 — Flows
Flows mode ranks markets by net inflow from the cohort over the last N hours. Buy-side dollars minus sell-side dollars; positive means they're accumulating, negative means they're distributing. The header summarizes what you're looking at; rows are markets, sorted by net inflow descending.
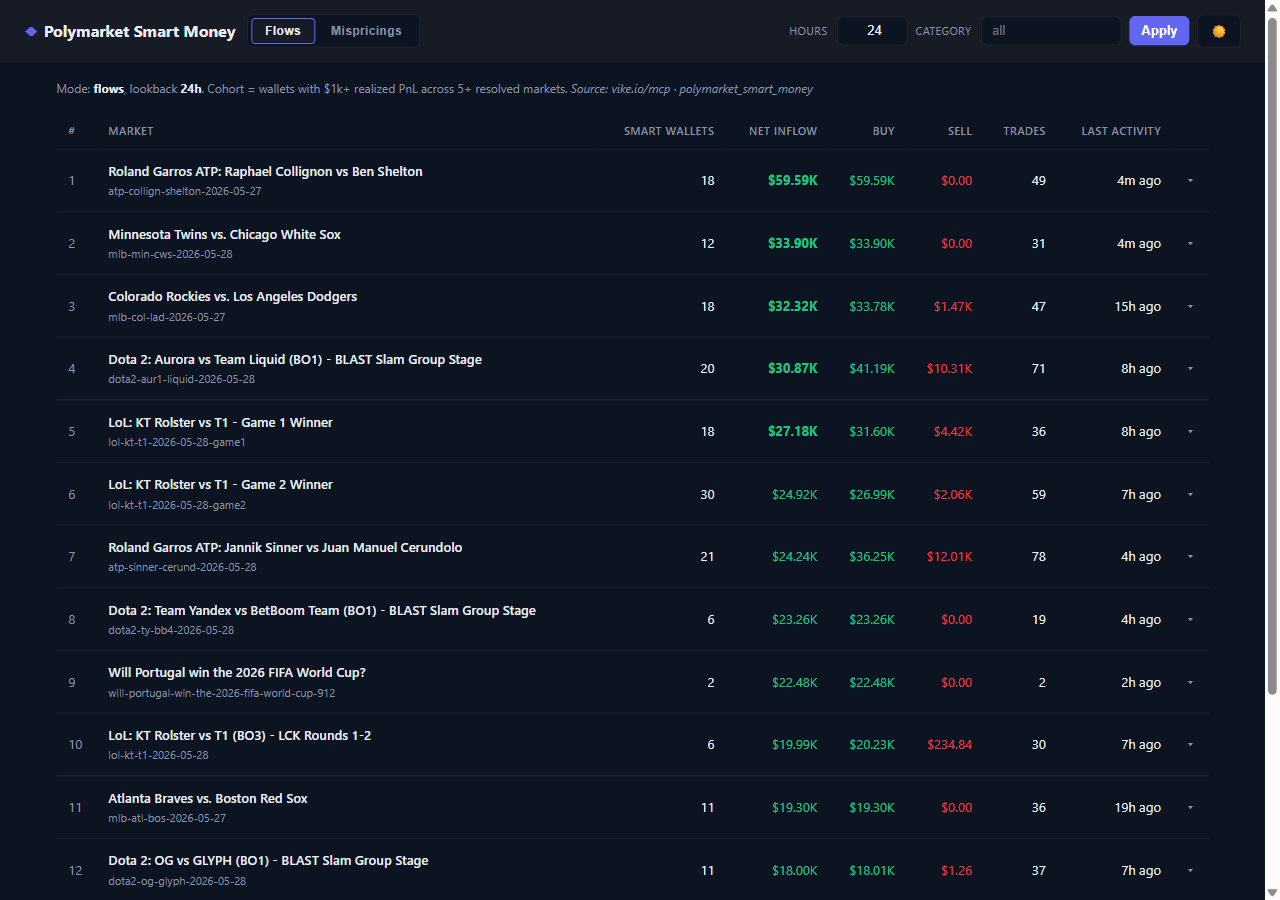
Every row links the market title straight to its Polymarket page, and the right-edge ▾ caret opens a per-market drill-in (more on that below).
Mode 2 — Mispricings
Same MCP tool, different mode argument. Mispricings returns markets where the cohort's average buy price sits meaningfully below the current mid. Different cohort signal, different column shape — Smart wallets / Cohort avg / Current mid / Edge:
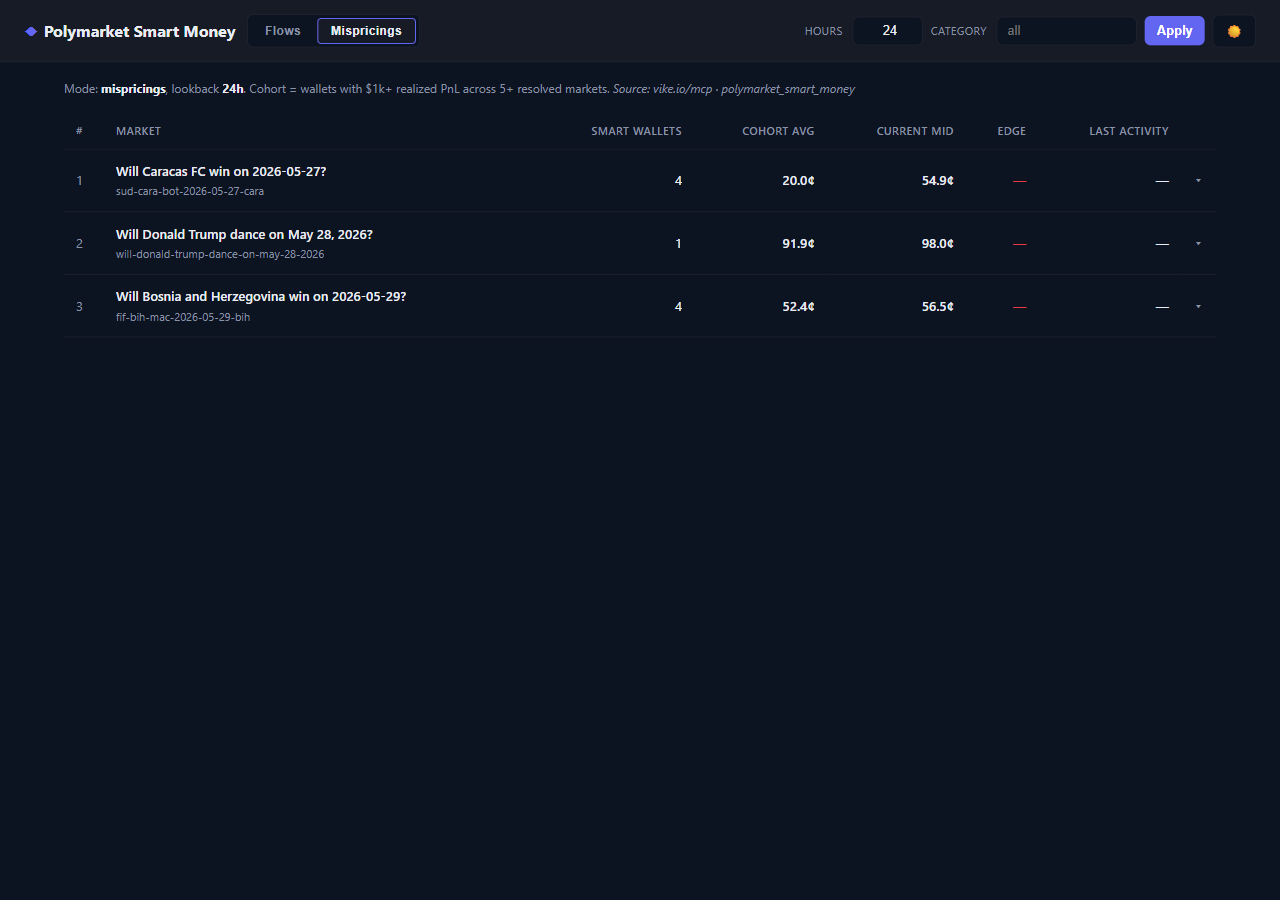
The mispricings list is short because the bar is high — the API only surfaces rows where the cohort's accumulation actually predates a meaningful re-rate. Top result in this run: cohort accumulated "Will Caracas FC win" at 20¢ and the market now trades at 55¢. Whether that's prescient money or wrong-side carry is a judgment call — what the demo gives you is the shortlist.
One tool, two output shapes
The whole "switch the view" mechanism is the mode argument on polymarket_smart_money. Nothing else needs to know which view is active:
const VIKE_MCP = "/api/polymarket-smart-money/vike/mcp";

async function loadSignals() {
  const args = {
    mode: state.mode,                        // "flows" | "mispricings"
    hours: Number($("#hours").value || 24),
    limit: 15
  };
  const cat = $("#category").value.trim();
  if (cat) args.category = cat;              // optional filter, server-side

  const res = await fetch(VIKE_MCP, {
    method: "POST",
    headers: { "Content-Type": "application/json" },
    body: JSON.stringify({
      jsonrpc: "2.0", id: 1, method: "tools/call",
      params: { name: "polymarket_smart_money", arguments: args }
    })
  });

  if (!res.ok) throw new Error(`Vike proxy ${res.status}`);
  const env = await res.json();
  if (env.error) throw new Error(`Vike: ${env.error.message || env.error.code}`);
  const text = env.result?.content?.[0]?.text;
  state.rows = JSON.parse(text);

  renderHeader();   // different columns per mode
  renderRows();
}
The only branching on mode happens in the renderer — the header columns differ, and a few row cells differ:
function renderHeader() {
  const thead = $("#thead-row");
  if (state.mode === "flows") {
    thead.innerHTML = `
      <th class="rank">#</th><th>Market</th>
      <th class="num">Smart wallets</th>
      <th class="num">Net inflow</th>
      <th class="num">Buy</th>
      <th class="num">Sell</th>
      <th class="num">Trades</th>
      <th class="num">Last activity</th>
      <th class="expand"></th>`;
  } else {
    thead.innerHTML = `
      <th class="rank">#</th><th>Market</th>
      <th class="num">Smart wallets</th>
      <th class="num">Cohort avg</th>
      <th class="num">Current mid</th>
      <th class="num">Edge</th>
      <th class="num">Last activity</th>
      <th class="expand"></th>`;
  }
}
Tab click → state.mode flips → loadSignals() re-fires with the new arg → server returns the right shape → renderer picks the right column set. About fifteen lines of glue total.
The second tool — drill into one market
Click any row's ▾ caret and the panel fetches polymarket_market_detail for that market's condition_id. The result is the full per-market envelope: YES/NO mid prices, volume, the top YES/NO holders among tracked wallets, and the recent trade tape with Polygonscan transaction links.
const detailCache = new Map();

async function fetchMarketDetail(conditionId) {
  if (detailCache.has(conditionId)) return detailCache.get(conditionId);
  const res = await fetch(VIKE_MCP, {
    method: "POST",
    headers: { "Content-Type": "application/json" },
    body: JSON.stringify({
      jsonrpc: "2.0", id: 1, method: "tools/call",
      params: { name: "polymarket_market_detail", arguments: { condition_id: conditionId } }
    })
  });
  if (!res.ok) throw new Error(`Vike proxy ${res.status}`);
  const env = await res.json();
  if (env.error) throw new Error(`Vike: ${env.error.message || env.error.code}`);
  return detailCache.set(conditionId, JSON.parse(env.result.content[0].text)).get(conditionId);
}
Two things worth pointing out:
- Same envelope, different tool. The JSON-RPC wrapper is identical to the list call — only
params.nameandargumentsdiffer. Adding a third MCP tool to this page would copy-paste this function. - Per-
condition_idcache. Once a market is expanded, its detail is held in thedetailCacheMap for the rest of the session. Re-expanding the same row is instant; switching tabs and coming back doesn't re-fetch.
The detail render is a fixed grid — stats row at top, two-column holders table (YES on the left, NO on the right), and a recent-trades table below with wallet handles and per-tx Polygonscan links. Resolved markets return empty holders (no live position to show), and the renderer shows a polite "This market has resolved — no live holder or trade feed available" when the upstream returns not-found.
Why this shape works
| Concern | Where it lives |
|---|---|
| Cohort definition ("$1k+ PnL across 5+ markets") | Inside the MCP tool, opaque to the client |
| Aggregating per-market flow / cohort buys | MCP tool, server-side |
| Picking which markets meet the mispricing bar | MCP tool, server-side |
| Filter args (mode, hours, category) | Client → MCP arguments |
| Lazy per-market drill-in | Second MCP tool, called on row click, cached per condition_id |
| Branching the column layout | Client, in renderHeader() |
The client doesn't know what "smart money" means or how net inflow is computed. It calls the tool with a mode, gets back rows whose shape matches that mode, and renders them. If the cohort definition tightens tomorrow, the demo updates without a code change.
Gotchas
- Short-lived markets often have empty drill-ins. Sports outcome markets (single matches) tend not to retain tracked-wallet positions in the detail tool — they resolve fast, holders close out, and the live feed empties. The article's flows screenshot shows several MLB/Dota/LoL markets; their per-market panels render as "No active YES positions among tracked wallets" because by the time you click, the event is over. The drill-in is more interesting on long-lived political/event markets.
- The "Edge" column can show
—. The server returnsedge_bpsonly when it has both a confident cohort buy price and a current mid; for some rows one of those is missing and the column blanks out. Cohort avg vs current mid is still informative on its own. - Cohort survivorship. The
$1k+ realized PnL across 5+ marketsfilter is computed on resolved markets, which means recently active wallets that haven't had enough markets close yet aren't in the cohort at all — even if they're directionally right. This is the standard tradeoff: tighter cohort = less noise, more lag. - Hours filter is lookback, not staleness.
hours=24means "rank by activity within the last 24 hours." Markets that the cohort accumulated three days ago and haven't touched since won't appear in flows even if the position is still huge — but they may appear in mispricings if the price re-rated. - MCP envelope shape, again.
env.result.content[0].textis a JSON string — theJSON.parseis mandatory and the bug it causes if forgotten is silent ("why isstate.rowsa string?"). Same trap as in the hl-top-traders and perp-funding-spread cases. - Category filter is server-side. The text input maps directly to
arguments.category. Unknown categories return zero rows rather than an error, so a typo just looks like an empty result.
The whole template is 561 lines including HTML, CSS, and both MCP tool integrations. The interesting work is the cohort definition and the per-market aggregation — both server-side, both invisible to the client.