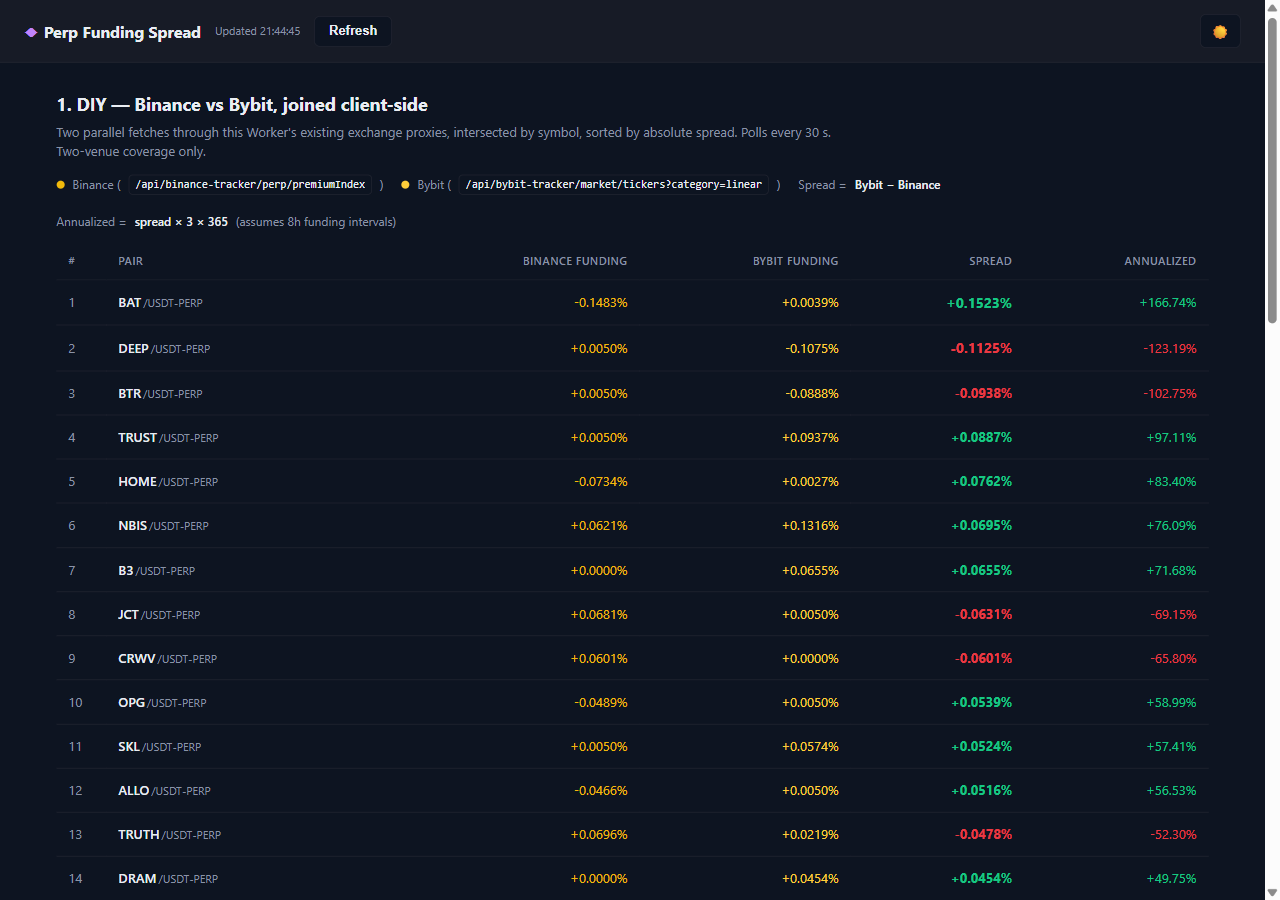
When perp funding diverges between venues, that's a clean cash-and-carry trade — long the cheap side, short the expensive side, collect the spread every funding interval. The hard part isn't the strategy, it's the plumbing: pulling funding from every venue you care about, normalizing intervals, joining by symbol, and ranking by spread.
This case puts two implementations of the same idea side-by-side on one page. The first is the obvious DIY version — fetch Binance + Bybit, intersect, sort. The second is one JSON-RPC call to vike.io/mcp's perp_funding tool, which does the same join across 6+ venues server-side and hands back the top spreads already normalized to daily %.
Live demo: demo.vike.io/perp-funding-spread/. Source: vike-io/demo-trading-apps/perp-funding-spread.
How it works
Both implementations are pure browser JS that calls the case's own Cloudflare Worker (/api/perp-funding-spread/...). The Worker just proxies upstream — Binance + Bybit public APIs for the DIY column, and https://vike.io/mcp (with the X-API-KEY header attached from the env) for the Vike column. No server-side compute, no caching, no DB.
A 30-second poll re-runs both implementations in parallel via Promise.allSettled, so a Vike timeout doesn't blank out the DIY table and vice versa.
1. DIY — Binance vs Bybit, joined client-side
Two parallel fetch()s into Map<symbol, fundingRate>, then a simple key-intersect and sort by absolute spread:
async function fetchBinance() {
  const res = await fetch("/api/binance-tracker/perp/premiumIndex");
  if (!res.ok) throw new Error(`Binance proxy ${res.status}`);
  const arr = await res.json();
  const map = new Map();
  for (const r of arr) {
    if (r.symbol?.endsWith("USDT") && r.lastFundingRate != null && r.lastFundingRate !== "") {
      map.set(r.symbol, Number(r.lastFundingRate));
    }
  }
  return map;
}

async function fetchBybit() {
  const res = await fetch("/api/bybit-tracker/market/tickers?category=linear");
  if (!res.ok) throw new Error(`Bybit proxy ${res.status}`);
  const body = await res.json();
  if (body.retCode !== 0) throw new Error(`Bybit retCode ${body.retCode}`);
  const map = new Map();
  for (const r of body.result?.list || []) {
    if (r.symbol?.endsWith("USDT") && r.fundingRate != null && r.fundingRate !== "") {
      map.set(r.symbol, Number(r.fundingRate));
    }
  }
  return map;
}
Both proxies are existing exchange wrappers in the same monorepo, which is why the URLs are bare paths. The join + rank step:
async function loadDiy() {
  const [bin, byb] = await Promise.all([fetchBinance(), fetchBybit()]);
  const symbols = new Set([...bin.keys(), ...byb.keys()]);
  const joined = [];
  for (const sym of symbols) {
    const b = bin.get(sym);
    const y = byb.get(sym);
    if (b == null || y == null) continue;   // need both sides for a spread
    joined.push({ symbol: sym, binance: b, bybit: y, spread: y - b });
  }
  joined.sort((a, b) => Math.abs(b.spread) - Math.abs(a.spread));
  state.joinedDiy = joined.slice(0, CONFIG.topNPairs);
  renderDiy();
}
Annualization assumes 8-hour funding intervals — spread × 3 × 365. That's the column the trader actually cares about: the BAT/USDT row at the top of the demo shows a +0.15 % per-interval spread that annualizes to +166 % if it holds.
function fmtAnnualized(n) {
  const annPct = n * 3 * 365 * 100;
  return (annPct >= 0 ? "+" : "") + annPct.toFixed(2) + "%";
}
About 80 lines for the whole DIY column, no dependencies. The catch shows up in the data: two venues only, and Binance + Bybit are both major liquidity hubs, so the spreads are mostly tight — the biggest ones in the screenshot above are around 0.15 % per interval. The really juicy spreads live where one leg is on a smaller venue.
2. Vike API — one MCP call, 6+ venues pre-ranked
The Vike column replaces all of that with a single JSON-RPC 2.0 call to the perp_funding MCP tool:
async function loadVike() {
  const res = await fetch("/api/perp-funding-spread/vike/mcp", {
    method: "POST",
    headers: { "Content-Type": "application/json" },
    body: JSON.stringify({
      jsonrpc: "2.0",
      id: 1,
      method: "tools/call",
      params: { name: "perp_funding", arguments: {} }
    })
  });
  if (!res.ok) throw new Error(`Vike proxy ${res.status}`);
  const env = await res.json();
  if (env.error) throw new Error(`Vike JSON-RPC: ${env.error.message || env.error.code}`);
  const rows = JSON.parse(env.result.content[0].text);
  state.joinedVike = rows.slice(0, CONFIG.topNPairs);
  renderVike();
}
The response is a flat array of {symbol, long_exchange, long_daily_pct, short_exchange, short_daily_pct, spread_daily_pct} objects — already joined across bybit, lighter, aster, coinbase, hyperliquid, bingx, kucoin and friends, already normalized to daily %, already filtered to spreads ≥ 0.3 % daily, already sorted by spread. Rendering is mechanical:
tbody.innerHTML = rows.map((r, i) => `
  <tr>
    <td class="rank">${i + 1}</td>
    <td class="pair"><span class="base">${r.symbol}</span></td>
    <td><span class="exchange">${r.long_exchange}</span></td>
    <td class="num">${fmtVikePct(r.long_daily_pct)}</td>
    <td><span class="exchange">${r.short_exchange}</span></td>
    <td class="num">${fmtVikePct(r.short_daily_pct)}</td>
    <td class="num spread">${fmtVikePct(r.spread_daily_pct)}</td>
  </tr>
`).join("");
The interesting result is in the data, not the code:
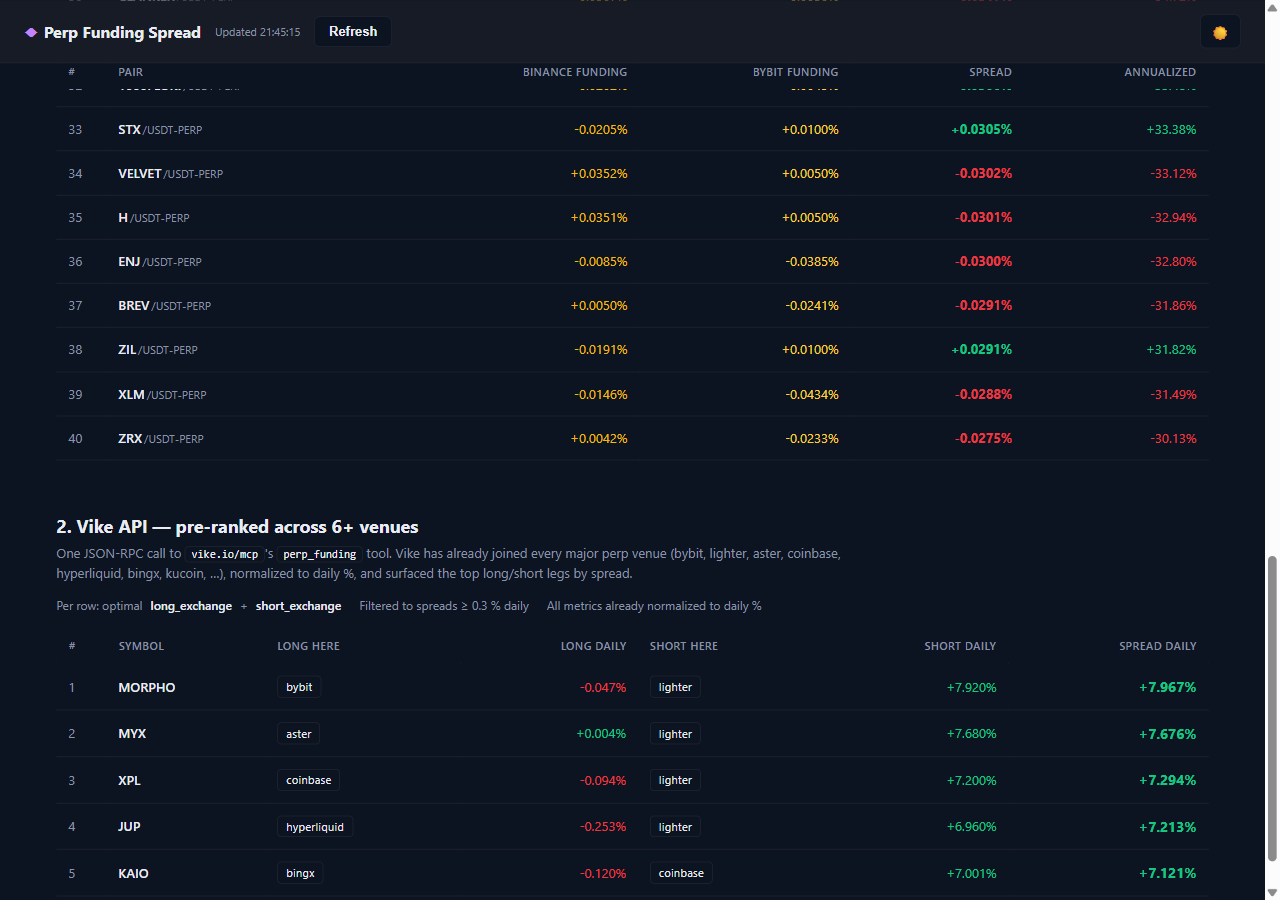
The Vike top row in that capture is MORPHO at +7.97 % daily, long bybit / short lighter. That's the same kind of pair the DIY column would never surface, because lighter isn't one of the two venues it queries. The DIY column's #40 row is showing ~0.03 % spreads at the same moment — three orders of magnitude smaller.
Why the second approach matters
| DIY (Binance + Bybit) | Vike API | |
|---|---|---|
| Venues covered | 2 | 6+ (bybit, lighter, aster, coinbase, hyperliquid, bingx, kucoin, …) |
| Network round-trips per refresh | 2 | 1 |
| Client-side work | fetch → Map → intersect → sort | JSON.parse(env.result.content[0].text) |
| Interval normalization | manual (× 3 × 365) |
already daily % |
| Symbol normalization across venues | none — would have to write per-venue | done server-side |
| Best spread visible right now (sample run) | +0.15 % per 8h interval | +7.97 % per day |
The DIY column is a great way to see how funding-rate arb works on a small surface. The Vike column is what you'd actually run if you wanted to trade it — the edge lives in the small/new venues, and those are exactly the ones the two-venue join can't reach.
Gotchas
- Funding interval differs by venue. Binance and Bybit are both on 8-hour cycles, so the DIY's
× 3 × 365annualization is honest. Across more venues you can't assume that — some perps fund hourly, some every 4 hours. The Vike response normalizes to daily % so the caller doesn't have to track per-venue cadences. - Symbols don't line up. "BTC perp" can be
BTCUSDT,BTC-USDT,BTC-PERP, or justBTCdepending on venue. The DIY column dodges this by only joining venues that already use Binance's<base>USDTconvention. A real cross-venue join needs a symbol-normalization step. - Direction sign matters. Funding rate sign convention is usually "longs pay shorts when positive" — but a couple of older venues invert that. Eyeball the result before sending an order.
- Spread ≠ realized return. The annualized number is what you'd earn if the spread held. In practice funding mean-reverts, so realized returns are a fraction of the headline. The screenshots above are a snapshot — the same pairs will look very different an hour later.
- MCP envelope. The
perp_fundingpayload arrives as a stringified JSON insideresult.content[0].text— that's MCP's standard envelope shape, not a Vike quirk. TheJSON.parseon the text field is mandatory.
The whole case is two HTML files and a Worker route — about 250 lines including styling. The interesting work happens upstream of the browser; the page just renders it.